|
APPLICATIONS: Computer & Information Sciences Advanced Networking Infrastructure & Research |
| Virtual Laboratory on a National Scale |
 |
 This demonstration of upper middleware complements Grid services, enabling scientists to easily extract information from raw datasets utilizing multiple computing resources. The Virtual Laboratory develops a formal series of steps, or process flow, to solve a particular problem in a particular application domain. The process steps may generate raw data from instruments, may contain data processing, may retrieve and store either raw or processed data and may contain visualization steps. A Process Flow Template (PFT) represents a typical analysis and visualization cycle of some raw experiment data.
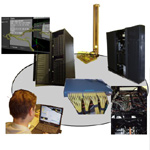
iGrid demonstrations include data cubes from the UvA Material Analysis of Complex Surfaces Lab and data cubes from an MRI brain scan. The Virtual Lab software assigns various clusters (using DAS-2, a wide-area distributed computer of 200 Dual Pentium-III nodes in The Netherlands) parts of a problem (retrieval, analysis, visualization, and so on). High bandwidth is a necessary prerequisite in order to do data analysis and visualization on a distributed system. Acknowledgment: Globus Project. Contact Zeger Hendrikse Universiteit van Amsterdam (UvA), The Netherlands zegerh@science.uva.nl Collaborators Zeger Hendrikse, Cees de Laat, Adam Belloum, Hamideh Afsarmanesh, Bob Hertzberger, UvA, The Netherlands David Group, NIKHEF, The Netherlands www.vl-e.nl/VLAM-G |